This is the second part of the “Remote debugging a Windows Azure Worker Role using Azure Connect, Remote desktop and the remote debugger”. In this part I will show you how to get the remote debugger on your worker role.
Step 2: Copy the remote debugger on your worker role instance
Start by creating a shared folder on your system, and copy the remote debugger file to it.
To do this select a folder on your system (maybe first create one) and select Properties…
Click on the Sharing tab, and click the Share button.
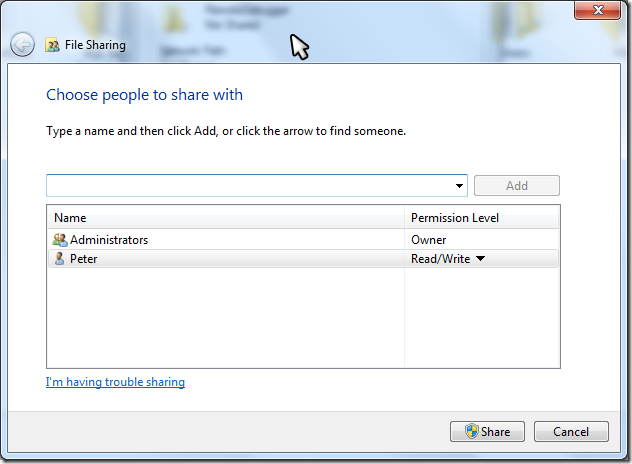
Click the Share button (you should already be in the list), and then click Done, then Close.
Copy the remote debugger files into this shared folder. You should find the remote debugger inside the Visual Studio folder. On my 64 bit machine this is in the C:\Program Files (x86)\Microsoft Visual Studio 10.0\Common7\Packages\Debugger\X64 folder…
Now we can create the remote desktop connection. Open the Azure portal, and go to your hosted service. Since we published the worker role you should find at least on instance… Select it:

This should enable the Connect button:

Click it to open the .rdp file. Accept the download by clicking the Open button.
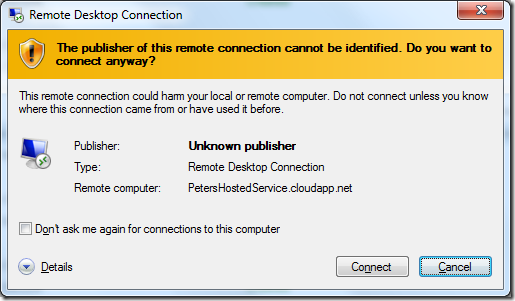
If you get the Remote Desktop Connection warning, click on Connect.
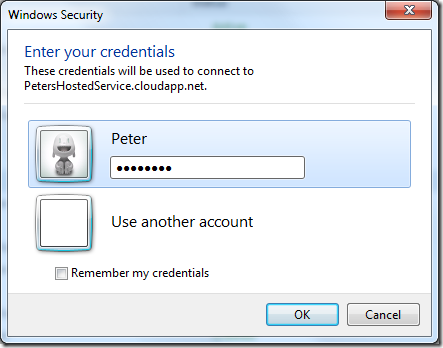
Enter your credentials (using your real username/password):
Again a warning will popup:
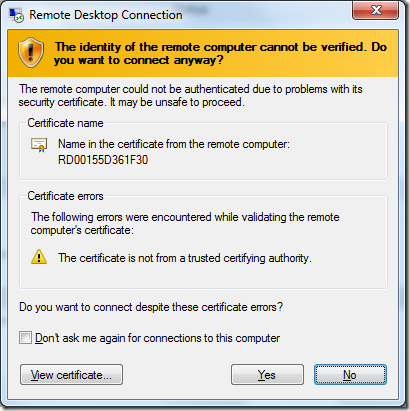
Select Yes (unless you don’t trust your own connection  )
)
Your remote desktop session should open. Minimize it because we still need to do something else…
Now we need to create a connection between the worker role instance machine and your machine.
Go back to the Azure portal and select the Virtual Network tab.
You should have the Local Endpoint installed (we did this in step 1) so you should see your computer and the role instances. To complete the connection we need to edit the role connections:

This should open the Edit Endpoint Group dialog. Click on the Add button to add your local group (called MyGroup on my configuration).
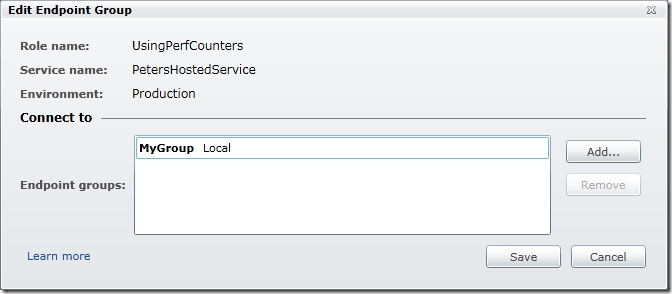
Click on Save.
Right-click the local endpoint (this is a little icon in the notification area of the taskbar) and select Refresh Policy. After a while this should look like this:

Now go back to your remote desktop session.
Open a command prompt and ping your own machine. This might need a couple of retries until the DNS gets updated…
Open the shared folder on your machine (on my machine I do this by typing \\vaiopeter\RemoteDebugger in an explorer window).
Create a folder on the remote machine (I call it RemoteDebugger) and copy the contents of the shared folder in it.
Now we are ready to connect the debugger and start debugging…