Project management has changed. Changed towards SCRUM based project management where you start by building a list of User Stories, also known as the backlog... This list of user stories allows you to plan the project by selecting the highest priority user stories, adding them to an iteration, planning the iteration and implementing it. User stories are assigned story points which is an abstract unit for measuring the amount of work.
Let’ start by creating a new Team Project. Nothing has changed in the “New Team Project” wizard except that the team project templates have been modified (to better support SCRUM like project management). Again you can choose between an agile template and the CMMI template. The CMMI (Capability Maturity Model Integration) template is more formal; in this post I’ll be using the agile template.
Creating user stories
A newly created team project will now be empty of work items; the intent is that you start by creating User Stories. These user stories describe the user’s needs. Then you prioritize the user stories and assign story points to them to estimate the work required.
A user story is a very slim and high-level user requirement. For example: “The delegate can pay by credit card to confirm reserving the course” (Personally I see user stories as short-hand versions of use cases). To create a new user story with Team System you can choose between Visual Studio, Excel or Team Web Access.
Using Excel
To create user stories you’ll probably want to use Excel. Previously I found the workbook that came with team foundation 2008 a little lacking, but now you get all you need to perform high level planning. So let’s set out and try this. Open Team Project explorer, and drill down to Documents->Shared Documents. Double click on Project Backlog.xlsm to open Microsoft Excel.
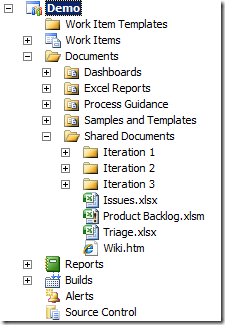
Ignore the security warnings if you get some...
The Product Backlog is a new workbook that enables you to manage your product backlog of work items from within Microsoft Excel.
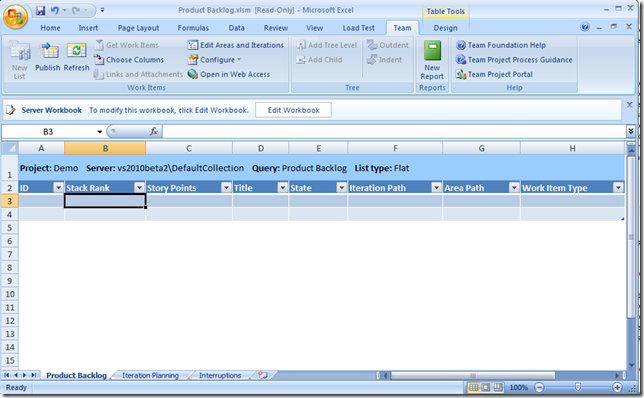
Start by refreshing from the server by clicking the Refresh button. This will synchronize your workbook with changes made to the server. From Excel you can also edit your areas and iterations, access Team Web Access, and create reports. But also take notice to the sheets in this workbook:

First one is for editing the backlog, second one is for high-level iteration planning and the third one is for planning interruptions. The workbook takes very good care of synchronizing changes from one sheet in the other. Let’s start with the first one: the product backlog.
The workbook is open in read-only mode by default, so start by clicking on the “Edit workbook“ button:

Then you can start adding user stories:

Prioritize your user stories by assigning a rank. Prioritizing user stories can be done in many ways, for example Karl Wiegers Kano model. You also need to assign story points as an estimate for the amount of work required (story points don’t generally use precise estimates, like hours or something).
Using Visual Studio
You can also use Visual Studio to add a new user story; then you’ll get this window inside VS:
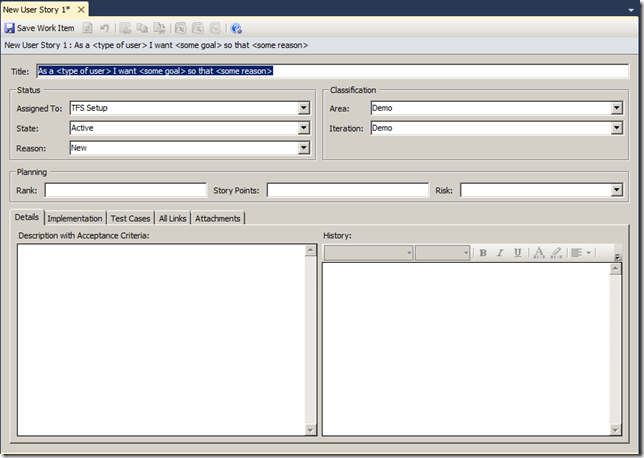
Please note the format of the title. This makes it a lot easier to think about user stories. Using VS for a single user story works like a charm, but for lists of users stories you’ll want to use Excel.
Using Team Web Access
Another option, which I think is quite realistic for project managers (and even end users), is to use a web site for editing work items. That is why Team System comes with Team Web Access. You can find the site from your team project portal. Then you can add any work item directly like this:
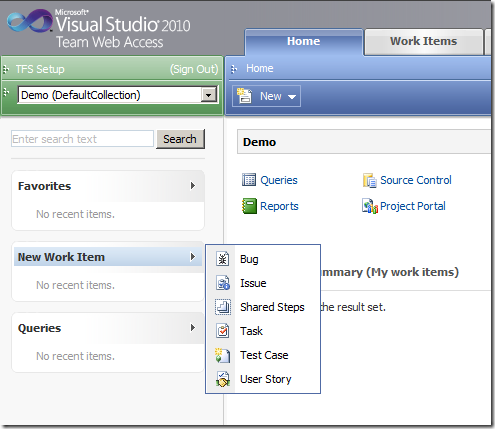
Select User Story from the drop down and you get this:
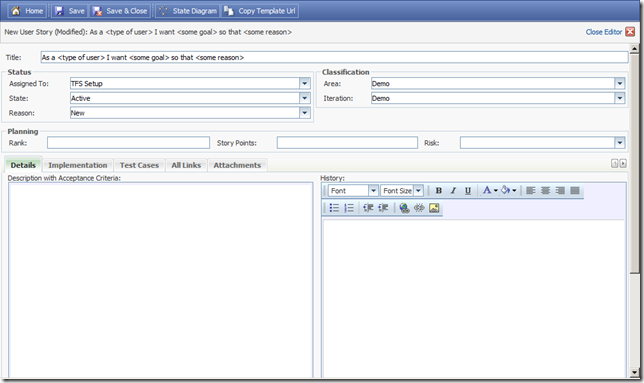
Again, you can add all necessary information directly.
Planning Iterations
Once you have a good idea about your user stories, you can start iteration planning. In this phase you will assign user stories to iterations. Each iteration will have room for a number of story points (this number is called project velocity, which is the average number of story points your team can do in a single iteration). Iteration planning is done with the Iteration planning worksheet.
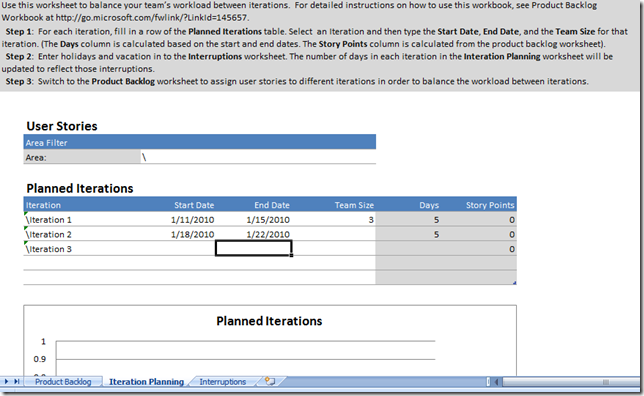
Note the help above. Once you’re familiar with this sheet you can hide the help. In here you plan your iterations. First you enter start and end date. The sheet will calculate the number of days for the iteration, taking into consideration any planned interruptions you entered into the interruptions sheet. Next you can start to assign user stories to iterations. The sheet will update again with a simple bar chart, making it easier to load balance your work over iterations:
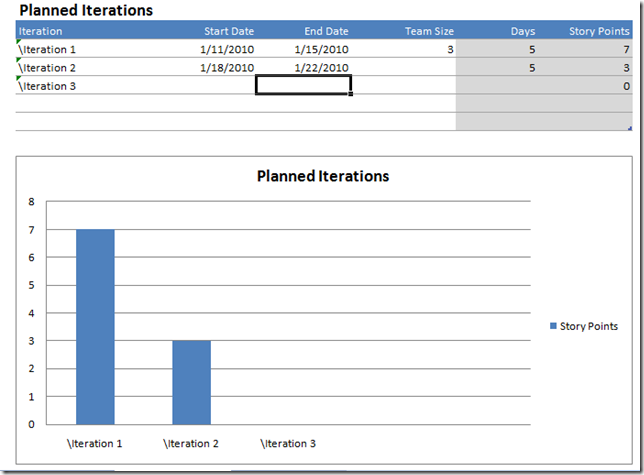
The interruptions sheet is just that, simply fill out any dates when no work can be done on the project because of holidays, special events, etc… The Planned Iterations sheet will automatically update nr of days with it. So for example, if we plan a team building meeting in Hawai on the 01/13/2010, the iteration will have 4 days:

That’s it for now. In my next post I’ll discuss detailed iteration planning with Visual Studio 2010.
Trying this yourself
If you want to try this yourself, I recommend you download the virtual machine from Microsoft (comes with sample data and all, and a bunch of labs).
The one using Virtual PC 2007
The one for Windows 7 Virtual PC
The one for Hyper-V Windows Server 2008