In Microsoft Azure, more and more possibilities are added to allow users to perform ETL or machine learning tasks based on a fully visual experience with no coding required. This empowers a much bigger group of people to get started with data engineering or data science tasks. That's great of course, but what if you do like to code, and want to enjoy the freedom and flexibility of writing your own code in a language like Python? No need to worry, Microsoft Azure has plenty to offer for Python programmers as well!
Azure Databricks
One example of a Microsoft Azure product where Python can be used is Azure Databricks. Azure Databricks is a big data and machine-learning platform built on top of Apache Spark. The idea is that using Databricks, you can easily set up a Spark cluster with which you interact through notebooks. And guess what, one of the supported languages inside such a notebook is Python.
Let's have a closer look at how we can use Python to fit machine learning models in Azure Databricks. We will set up a Databricks cluster and import a demo notebook. In the notebook, Python code is used to fit a number of machine learning models on a sample data set. The notebook is based on an official Databricks notebook.
Setting up a Databricks cluster
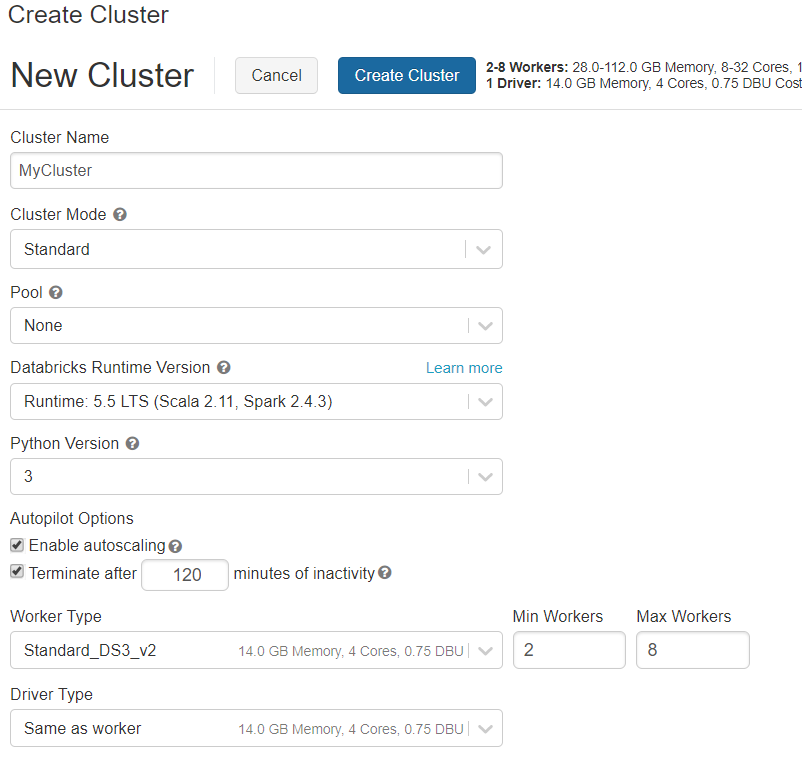
In the Azure Portal, create a new Databricks service. When the Databricks Service is set up, launch the workspace. Under Common Tasks, you can create a new cluster. Let's create a standard cluster using the default settings.
Creating or importing a notebook
Notebooks are the interface to interact with Databricks. A notebook is a web-based interface that can contain text and runnable code. You can create a new notebook in Azure Databricks under Common Tasks – New Notebook. In this notebook, you can create text cells (by starting the cell with %md) or code cells (supported languages are Python, R, SQL and SCALA). Read more about using notebooks here.
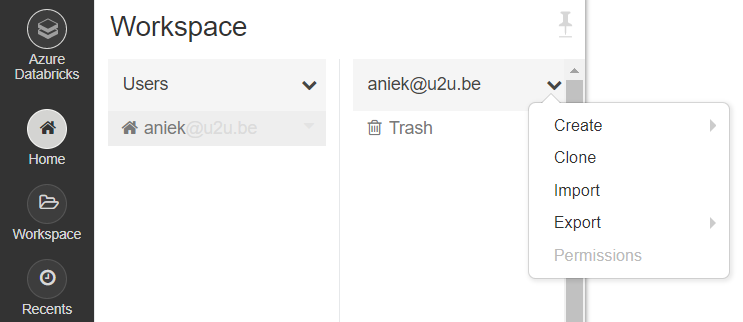
Instead of starting a notebook from scratch, you can also import an existing notebook. To do this, click home; the arrow next to your username; import.
In this way, you can import the demo notebook, after downloading it from here. You can run each cell in the notebook using CTRL + Enter.
Using Python to fit machine learning models in the notebook
To support Python with Spark, we will make use of the PySpark library. This library is automatically imported in a notebook. We will use PySpark (including its MlLib library for machine learning) instead of commonly used libraries such as pandas and scikit learn, because these traditional libraries don't allow for scaling in a distributed environment.
Next, we will see how we can use Python inside the notebook to get and prepare data, to fit some machine learning models, and to evaluate them. Use the imported demo notebook to try this out on your own Databricks cluster.
Getting the data into a PySpark Dataframe
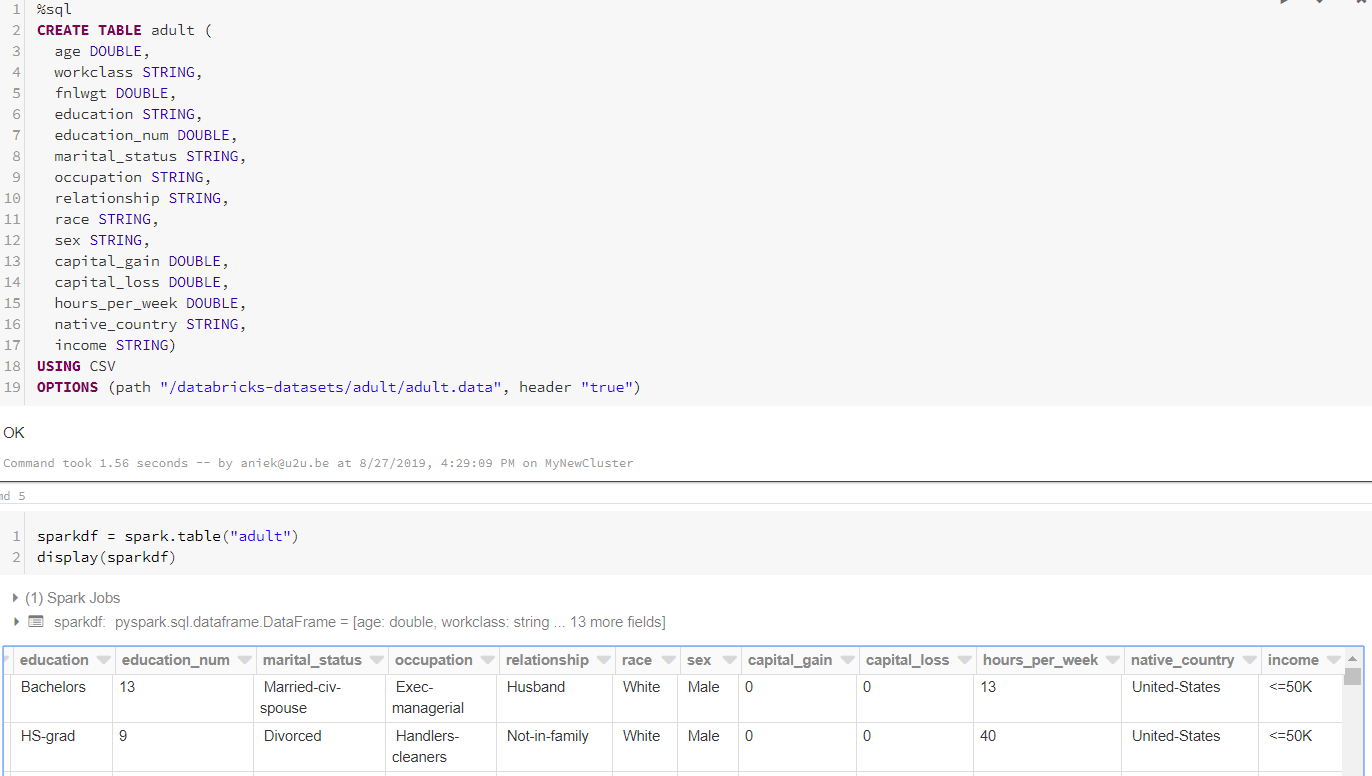
To keep things simple, we will use a sample data set provided by Databricks. The data set contains information about US citizens; the goal is to predict whether a person earns less or more than 50K based on his/her characteristics. We will load the data in SQL using the CSV data source for Spark and then convert it to a PySpark data frame. This type of dataframe (unlike a Pandas dataframe) is distributed across the cluster.
Preparing the data using Pipelines
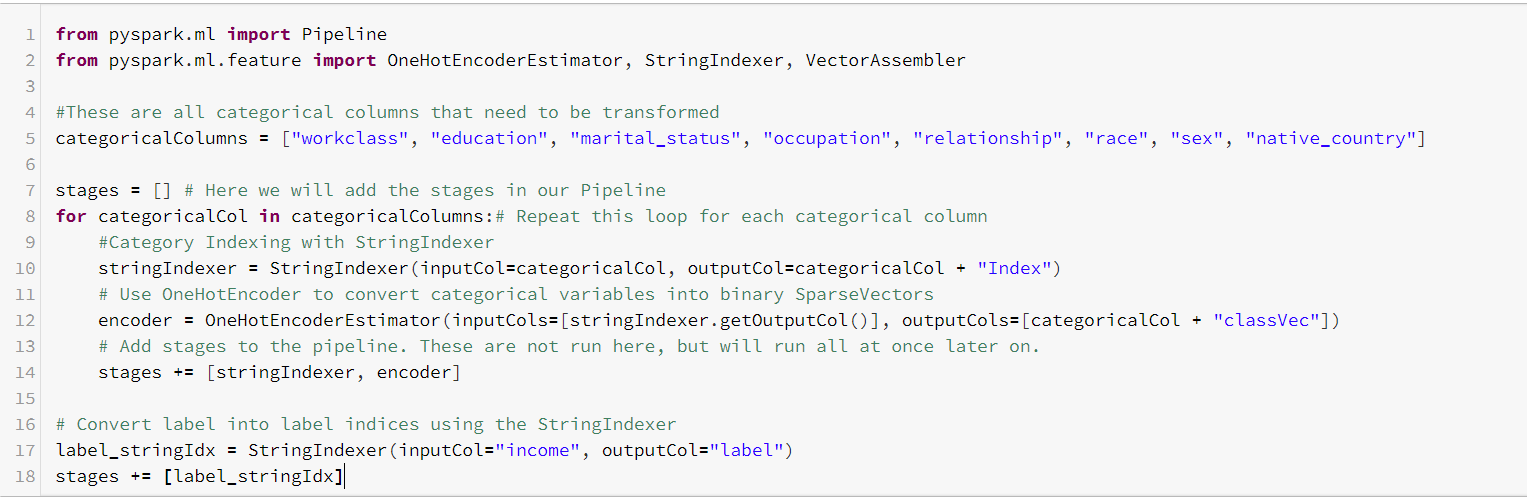
Before we can fit a machine learning model to this data set, we will need to transform it in several ways. First of all, we should transform the categorical columns (both features and label columns) to numerical ones. We will do this in two steps: First, we use StringIndexer to transform each categorical column into a column of indices. Next, we use OneHotEncoder on each index column, which will create a new binary column for each unique index value.
Second, we merge all feature columns into a single vector column using VectorAssembler.

Notice the stages list to which we add each transformation step. This variable is used to create a Pipeline, in which we group together all transformations. That allows us to easily see the entire transformation workflow. The pipeline is based on a sequence of stages. The data set passes through each stage and gets transformed step by step. Let's set up and execute the Pipeline.

Fitting Machine Learning models
Once our data set is prepared correctly, we only need to divide it into a training and test set before we fit our machine learning models to it.

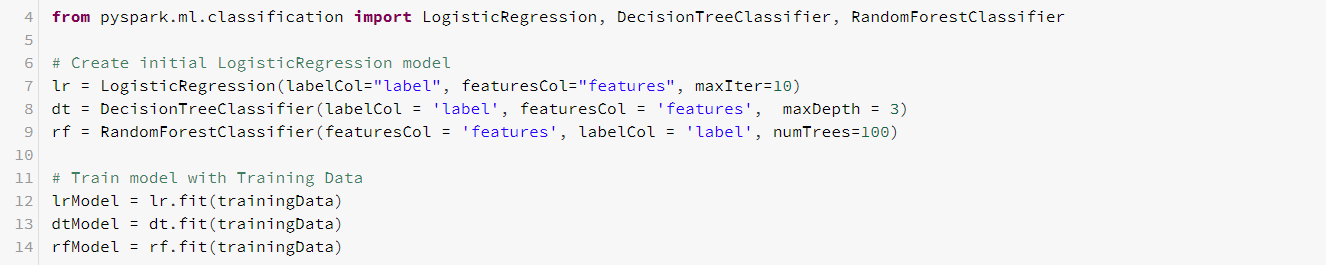
Let's fit a logistic regression model, a decision tree and a random forest to the training data. For the sake of simplicity, we will not do any hyperparameter tuning, and mostly stick with the defaults. Notice that we just need to provide two columns for each machine learning algorithm: The column with the labels, and the vector column in which we merged all features.
Evaluating the Machine Learning models
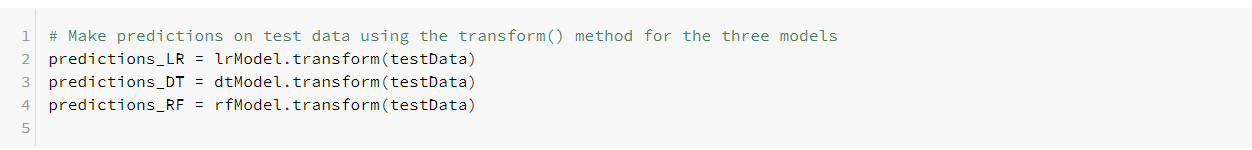
Now that we have fitted our three models, we can use them to make predictions on the test data.
Next, we can compare the predictions that the three models make. One common way to do that is in terms of their area under the ROC curve. We can use the BinaryClassificationEvaluator to get these numbers.
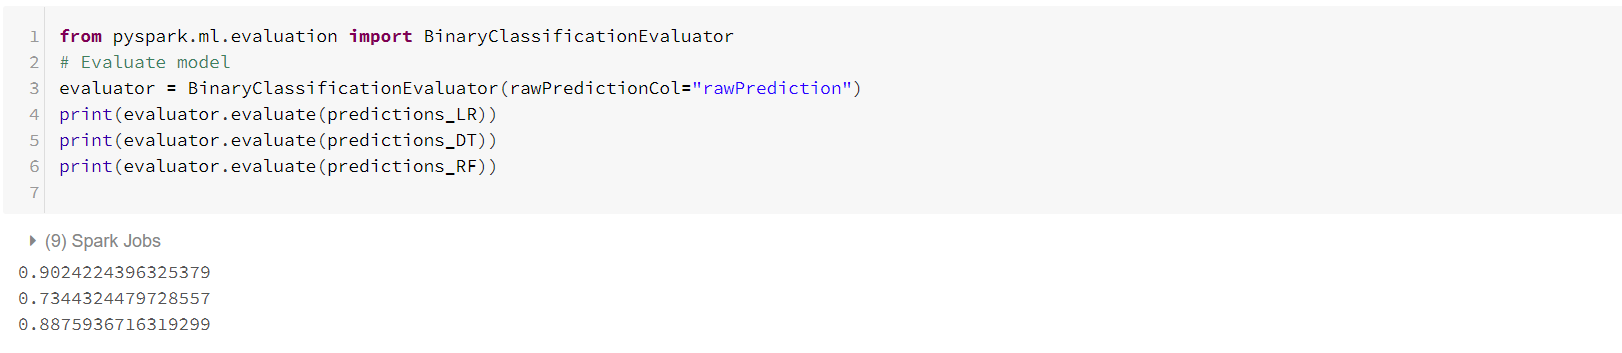
Apparently, in this simplistic setting (without any tuning involved), the logistic regression model performs best in terms of the area under the ROC curve.
That's it for this blog! Keep in mind that Databricks is just one example of how you can use your Python skills in Microsoft Azure. Stay tuned for more possibilities :-)