So what does Visual Studio 2010 bring for testers? A whole lot! Especially the new test environment, where you can create a test plan to validate the quality of the software you’re building. A test plan is a collection of test cases, which you can then run. While running the system keeps track of a whole lot of things, including code coverage and IntelliTrace information. And finally this application allows you to examine the combined results of all tests, to see how your development effort is doing.
So again: A test plan is a collection of test suites, used to test a certain iteration in your project. A test suite is a collection of test cases to test a certain part of your project, and a test case is a test for a project feature. A test case is basically an UI test running in a specific environment. To model this, Test and Lab manager also allows you to define a test configuration, which is a certain environment for your code, for example Windows 7 with IE8, or Windows XP SP2 with IE7.
Running Test and Lab Manager
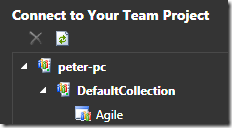
First time you run this application it will ask for your Team Foundation Server (TFS) and after that, for the Project Collection and Team Project:
Ok, next step it will ask you for a test plan; since there are none you will have to create a new one:
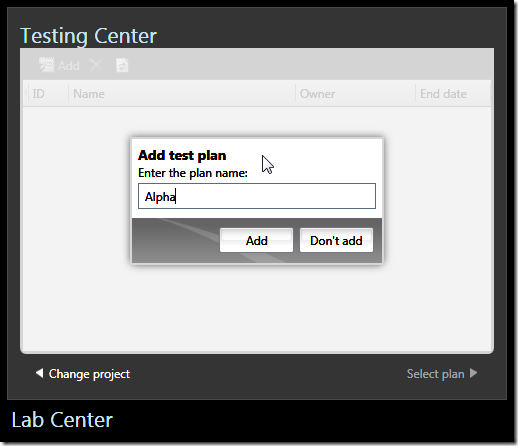
Then click “Select plan >”.
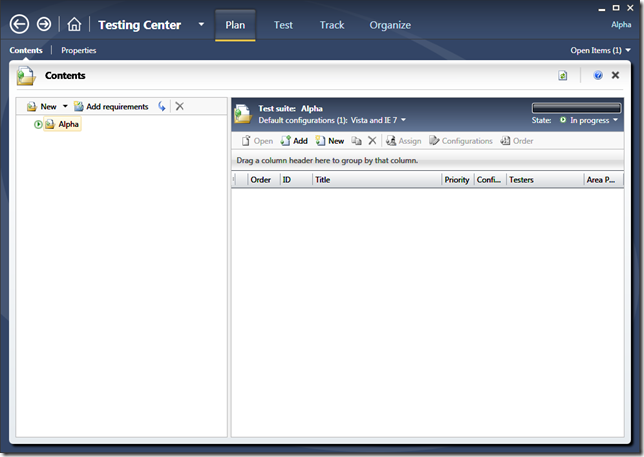
This opens the test plan.
if you want you can change some of the properties of this test plan by clicking on the properties tab:
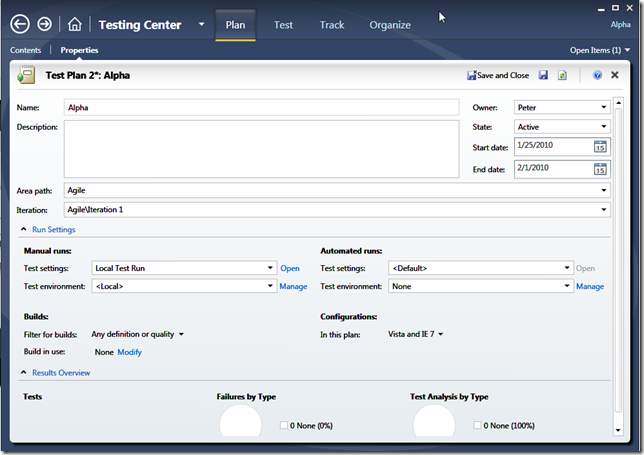
Here you can change the iteration for example, or the test settings.

With test settings you can change how your tests will be executed. For example in the Local Test Run settings you can change the diagnostic data adapter, which record data from your test run. For example is you want an action recording, event log entries, etc… You can also use it to emulate certain environments, for example running low on memory. You can even create your own data adapter.
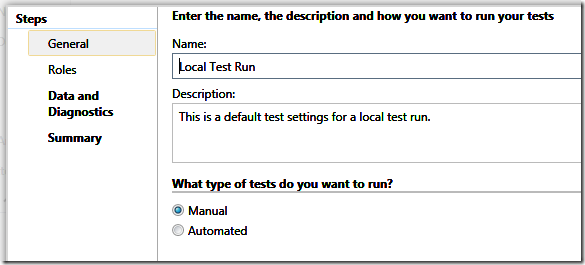
This first page allows you to change the name, and choose between running a manual or automated test.
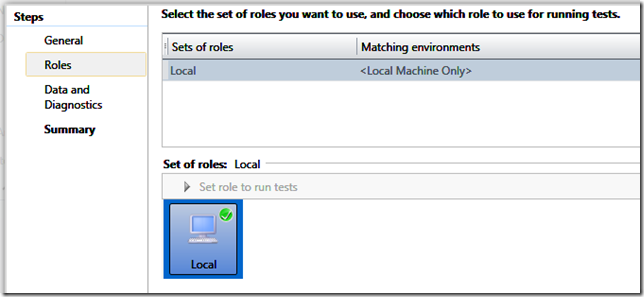
On the second page you can define the roles. You define a role for each tier to use to run tests and collect data. One the local settings you can only have one role, your own physical machine. If you want to use roles, you will also have to define environments.
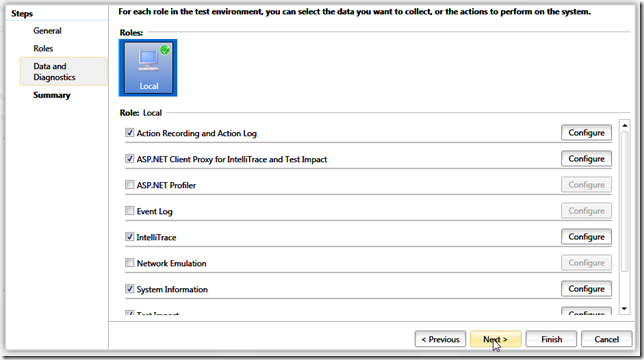
Here you can define what kind of data you want to gather. For example, the Action Recording will record each action taken during the test, making it easy for another person (typically a developer) to understand what happened during running the test. The Action log is a text version of the recording. IntelliTrace will allow a developer to load the IntelliTrace log and step back in the code, to see how the error came to be.
Go back to the Contents tab.
Now we’re ready to test some of our user stories (from now on I will be using User Stories, but this could just as easily be called a requirement or anything else to denote a certain needed functionality of your software system). Test cases are grouped into test suites. Per test plan you have a default test suite, but you can also create a test suite for a specific user story, copy a test suite from another test plan, create a nested suite or create one from a query:
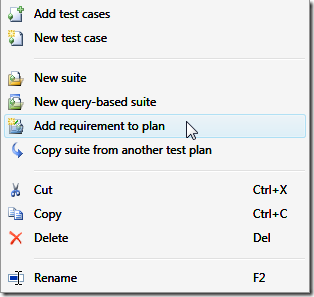
If you select “Add requirement"to plan” you will need to select a user story. This user story is now associated with this test suite. This will allow reporting to figure out which tests have ran for which user story.

Now we’re ready to add a test case, so click the New button. The New Test Case dialog should show:
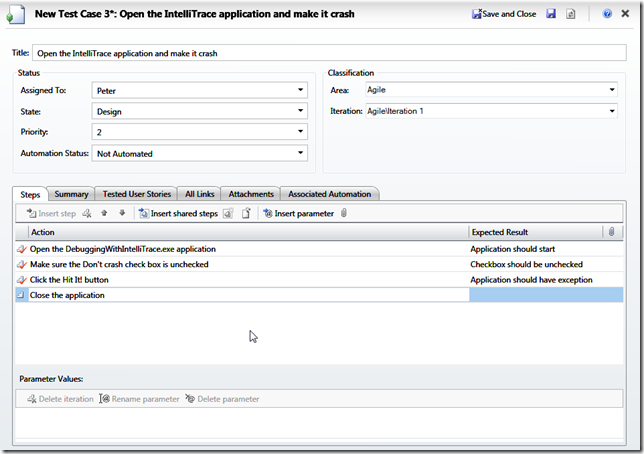
Add the four steps (please note that we’re doing this for the sake of the demo, normally your requirement should not be to crash :) ). Save it.
Click on the Tested User Stories tab: the User Story should be there. Save and Close.
A couple of other things you can now do is to assign it to a tester, and/or change the configurations:

Let’s run the test. First open the Test tab: 
From here you can see all test cases for a test suite:

Select the test case and click on the run button. The Test Runner should open:
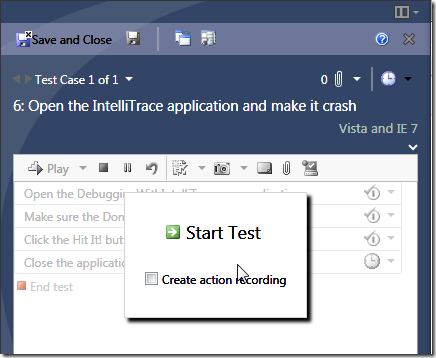
Check the Create action recording button and hit Start Test. Do as the test case says, and try to use a repeatable way to start the application (for example using the start menu). The first and second step should not be a problem, so click the drop down boxes to the right of each step to indicate success:
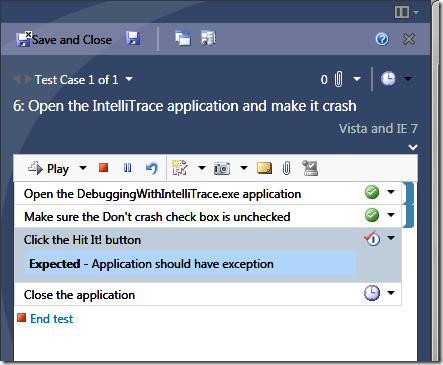
Now make the third step fail. You’ll need to enter a comment why it failed. Then click the End Test hyperlink button. You’ll see test center gather some information.
On top of the test runner window you’ll see a toolbar. Click on the Create Bug button:
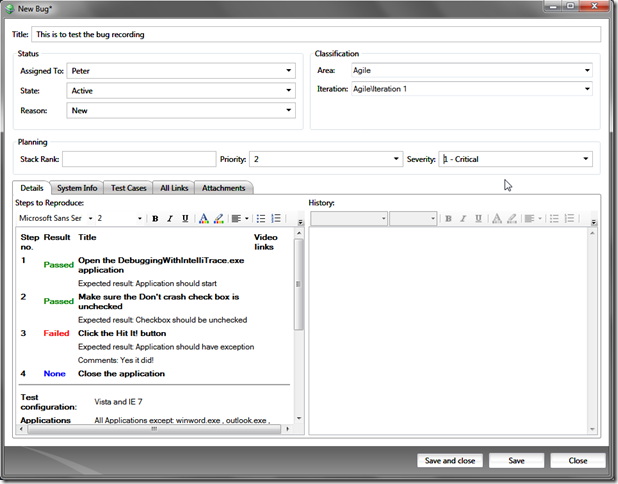
You’ll see that most of the fields are automatically filled in. You might want to change the Severity for example, and maybe assign it to a certain tester, but that is all… Click Save. Check out the information included in the System Info, and All Links tab. Close it.
Remember me asking you to start the application using some repeatable way? Well, try and click on the play button. Your test should replay again. This makes it easier to re-test later.
Coming back to Test and Lab Manager. The test case failed so now the UI updates to show this:

If you have more than one test, the bar will color depending on how many succeeded, failed or are still in progress.
Later you can come back and verify if a bug still exists by using the Verify Bugs tab:

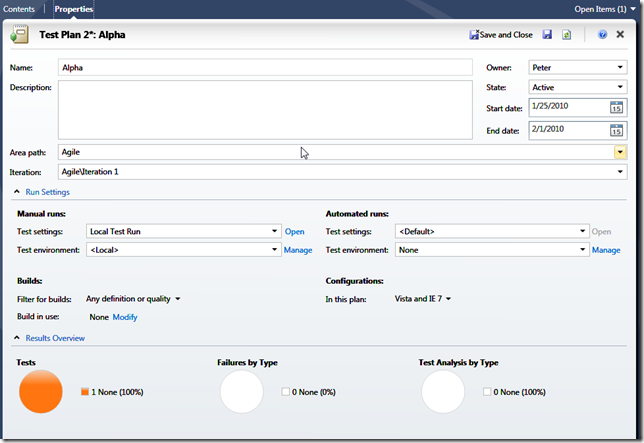
Go back to the Plan tab, then open the properties. Now you should see an overview:
Back to Visual Studio, so close the Test and Lab Manager. Go to the Team Explorer and open the My Bugs query. You should see the bug we created before. Open it:
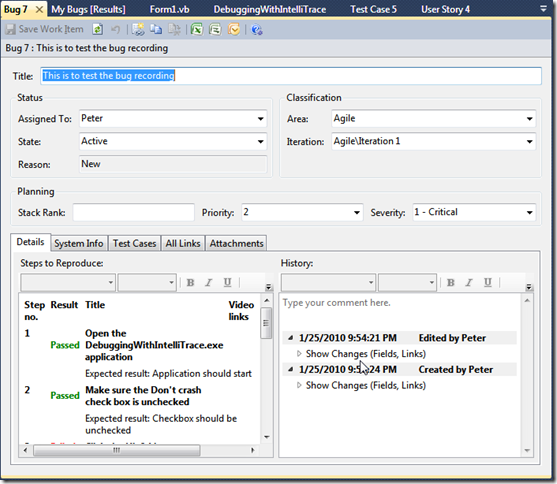
Go to All Links, and open the IntelliTrace log (.tdlog). With it you can now replay the bug, just like in my previous post on IntelliTrace. If this doesn’t work, go back to the test settings. You might also like the Video feature, so you can replay the user’s actions!