Visual Studio 2010 Ultimate now has IntelliTrace, which is a historical debugging feature. IntelliTrace will keep track of everything your code has been doing and then, when a bug arrives, you can back-track to the possible cause of the bug. You might think this is nothing new, but don’t forget it also tracks the value of any variable at that moment in time. With the usual debugger you will see the latest value, not the value at that moment.
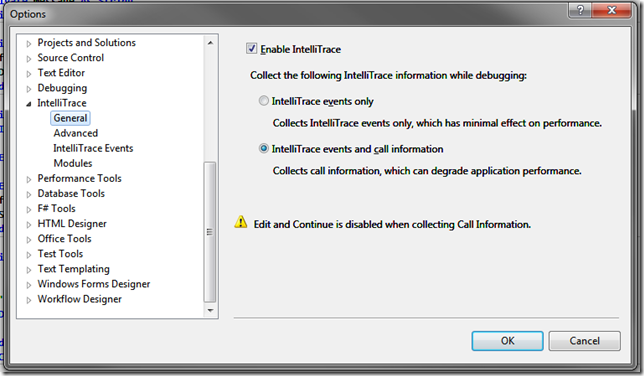
You can enable (and it is enabled by default) by going into Options->IntelliTrace->General
If you want to try this, build a simple windows forms application with a Button and CheckBox. Then add code as follows:
1: Public Class Form1
2:
3: Private message As String
4: Private flag As Boolean
5:
6: Private Sub Button1_Click(ByVal sender As System.Object, ByVal e As System.EventArgs) Handles Button1.Click
7: flag = FlagCheckBox.Checked
8: Doh()
9: End Sub
10:
11: Private Sub Doh()
12: If flag = True Then
13: message = "This should work"
14: Else
15: message = Nothing
16: End If
17: flag = True
18: ShowMessage(message)
19: End Sub
20:
21: Private Sub ShowMessage(ByVal message As String)
22:
23:
24: ' Throw exception if message is empty
25: Dim len As Integer = message.Length
26:
27: End Sub
28: End Class
Run it with the checkbox unchecked. This should cause the application to stop in the debugger:
Your code should look like this:
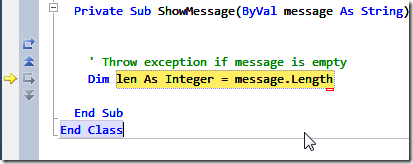
See those special arraws in the gutter (the gutter is the section where you click to add/remove breakpoints)? These will allow you to backtrack.
You should also have a IntelliTrace window looking like this (two views are available):
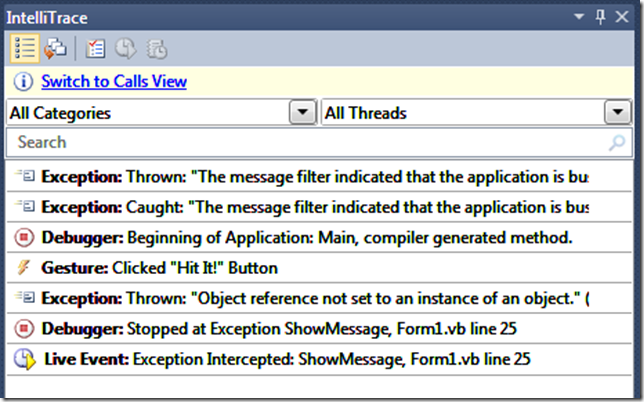
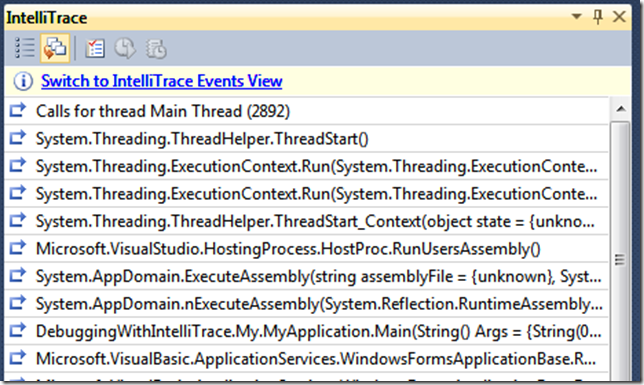
With these you can jump directly to one of your code’s stackframe.
Let’s try stepping back to see what happened. Press the back arrow, or better yet, use the keyboard shortcut (on my machine that is Ctrl+Shift+F11):

You should now be able to step back in time, for example look how my IDE looks like when stopped at the ShowMessage method:
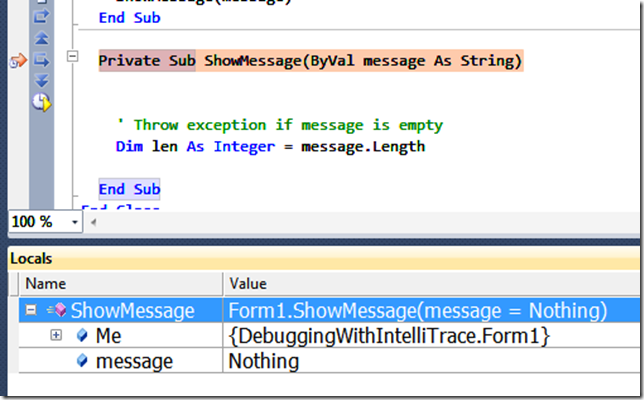
IntelliTrace keeps track of the values of the arguments and such, at each point in time.
For example, a little higher in the code I changed the flag variable to true, while the bug is caused because it was false before. IntelliTrace will show me this.
1: Private Sub Doh()
2: If flag = True Then
3: message = "This should work"
4: Else
5: message = Nothing
6: End If
7: flag = True
8: ShowMessage(message)
9: End Sub
IntelliTrace will save all of this information in a file (now with an extension called iTrace, notice the naming convention <GRIN>), and because you can open this file afterwards, all kinds of scenario’s can now be implemented. You can send the file to a colleague so he/she can help you debug the problem.
So where is this file? Go back to Tools->Options->Advanced and copy the directory for later:
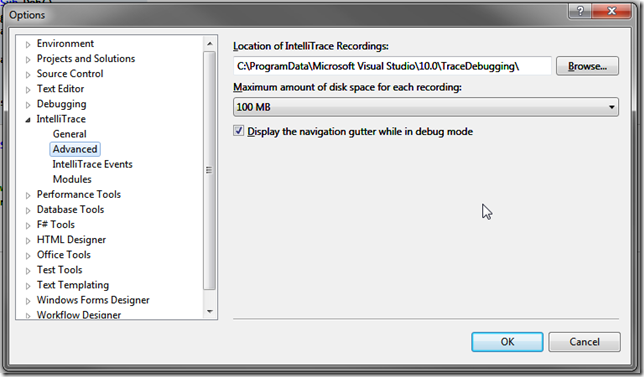
Open this directory in file explorer and copy the file to where you like. You will have to stop debugging, otherwise Visual Studio keeps a lock on the file. Don’t stop Visual Studio, because VS throws away the log file when it quits.
When you open the file again, Visual Studio will show the log’s summary:
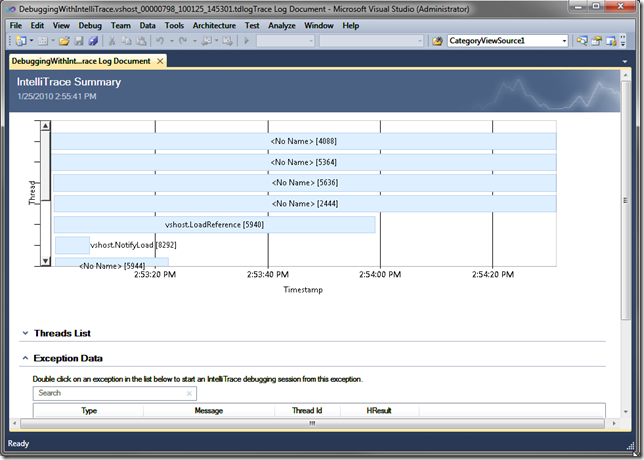
Open the Thread Lists and look for the thread you want to see (probably the main thread):
Double click it and with a little patience the debugger will open (make sure Visual Studio can find the sources).
Or better even, the Visual Studio Test and Lab Manager 2010 can do this for you. So even if you have a non-technical user who is testing some application, and finds a bug, the IntelliTrace file will be attached automatically!