The corona virus SARS-Cov-2 and the disease it causes (CoViD19) is all over the news, and despite all the news, there is currently not much we already know about this virus.
But BI people wouldn't be BI people if even with a bit of information they would start making predictions. We do know from the roughly 90000 people who got ill that the mortality rate mainly depends on the age of the victims (see figures at https://www.worldometers.info/coronavirus/coronavirus-age-sex-demographics/). And after some basic search I found that the website of the Organisation for Economic Co-operation and Development (www.oecd.org) has the number of people in different age groups for a bunch of countries (I only found numbers for the year 2011, current population will be slightly higher).
The only thing we don't know at all is which percentage of the population will get infected by the corona virus. So what we don't know, we convert into a What-if parameter.
Before I start showing some numbers, a few warnings:
- The report does not take into account the gender, medical preconditions, ...
- It does assume that the virus spreads through all age groups equally frequent
- It does assume the mortality rate seen so far will apply to newly infected patients as well
OK, so let's assume the above assumptions are true, and that the virus infects slightly more people than the traditional flu: 20% instead of the 5% to 15% which get infected by the regular flu.
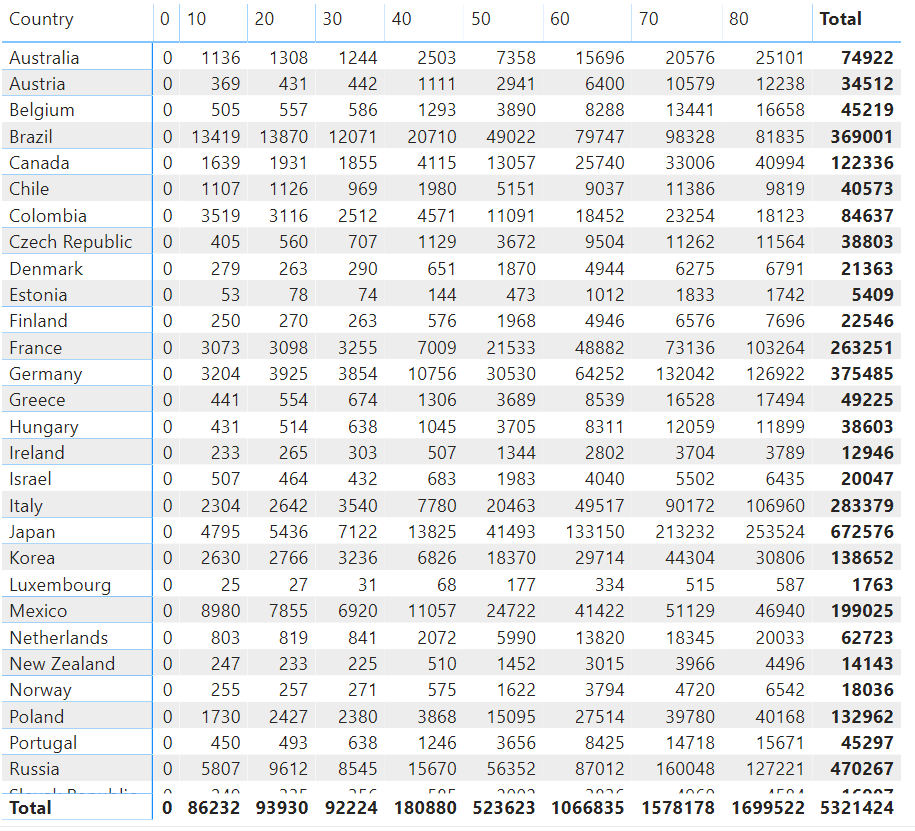
The table below shows the expected number of deaths per country per age group:
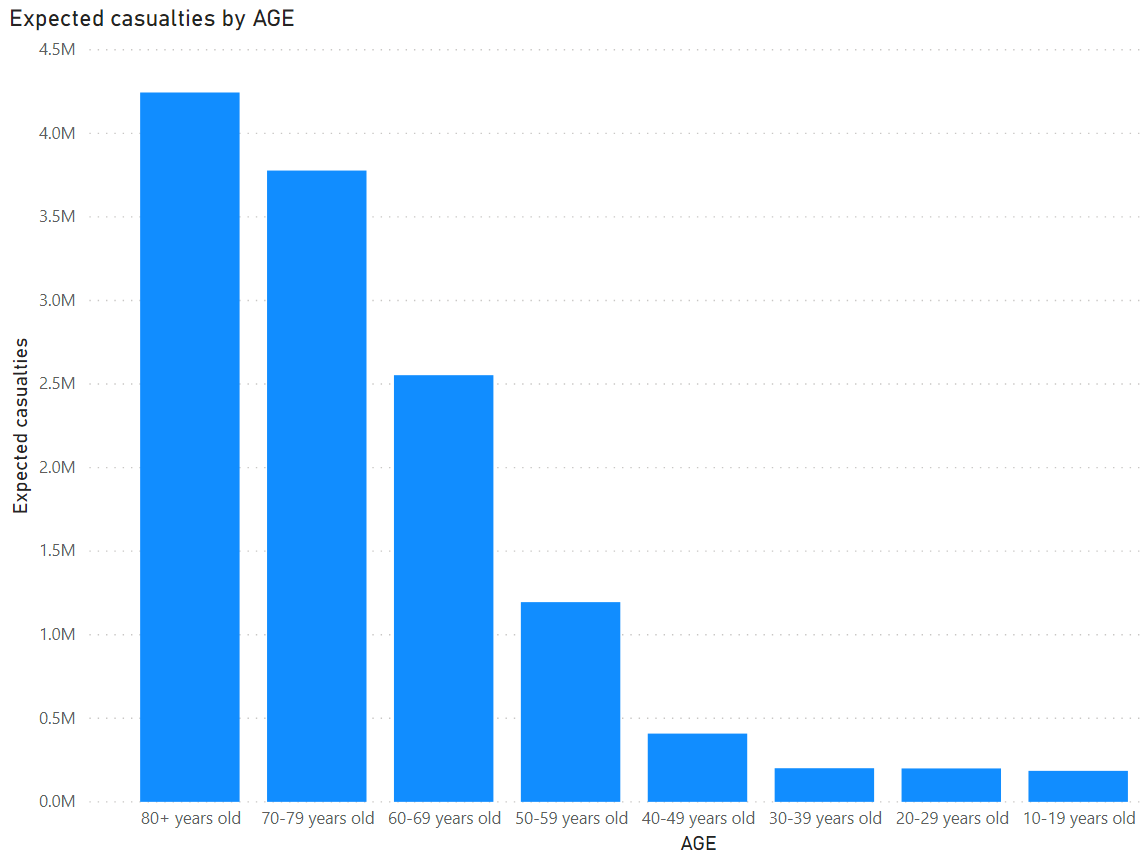
The chart below shows the expected number of casualties in Belgium per age group.
If you want to adjust the amount of infected people, or you want to zoom in on another country, below you can play around with the live Power BI report: