Building software, especially software running on servers, requires some way to look “inside” the running application. Using the debugger is one way, but you cannot use a debugger on production applications. A better way is to use performance counters. These give you a way to see things, like how hard the CPU working, but also how many orders have been processed by your system. The first performance counter is provided by the system, the latter you can build yourself.
Before Azure SDK 1.3 you couldn’t create your own performance counters because your code doesn’t get write access to the region of the registry where you register your custom performance counters. But with elevated startup tasks this is easy. In the blog post I will show you how you can create a startup task to create custom performance counters, and how to use them in your role.
Commence by creating a new Visual Studio Cloud project. Add a single worker role. We’ll use this role to illustrate using a performance counter.
Add another project, now a Console project (call it InstallPerfCounters). We’ll use this console application as the startup task.
Implement the InstallPerfCounters console project as follows:
Code Snippet
- class Program
- {
- static void Main(string[] args)
- {
- const string categoryName = "U2U";
- const string categoryHelp = "U2U demo counters";
-
- if (!PerformanceCounterCategory.Exists(categoryName))
- {
- var counters = new System.Diagnostics.CounterCreationDataCollection();
- counters.Add(new CounterCreationData
- {
- CounterName = "# secs/running",
- CounterHelp = "How long has this been running",
- CounterType = PerformanceCounterType.NumberOfItems32
- });
-
- var category = PerformanceCounterCategory.Create(categoryName,
- categoryHelp, PerformanceCounterCategoryType.MultiInstance, counters);
- }
- }
- }
This uses the same kind of code you would use anywhere else to create new performance counters.
Now we need to install this as a startup task. Add a folder to the worker role project, calling it startup. We need to add two files here, one the console project we just made, and a command file.
To copy the executable, let’s make first sure we’re using the release version at all time. Open the configuration manager:
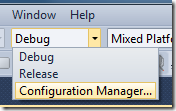
Select Release as the configuration:

Build your project, ensuring everything compiles nicely.
Now right-click the startup folder from the worker role project and select Add Existing Item… Browse to the release folder of the console project, select the executable and choose Add As Link from the drop-down:
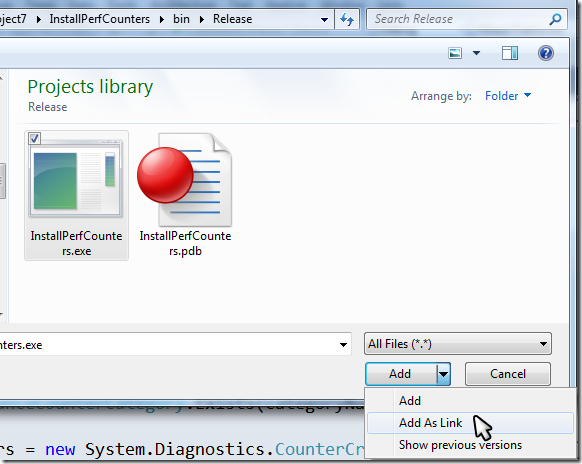
This should add the executable to the startup folder. Select it, and select Copy Always in the properties folder:
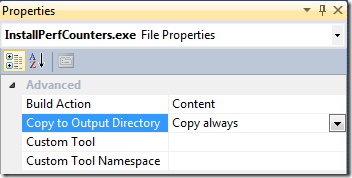
Now we are ready to add the command file. Don’t use Visual Studio for this, because it will add the Byte Order Mark which is not supported by Azure. The easiest way to do this is by right-clicking the startup folder, and select “Open Folder in Windows Explorer”. Then right-click the folder’s contents, and add a new text document:
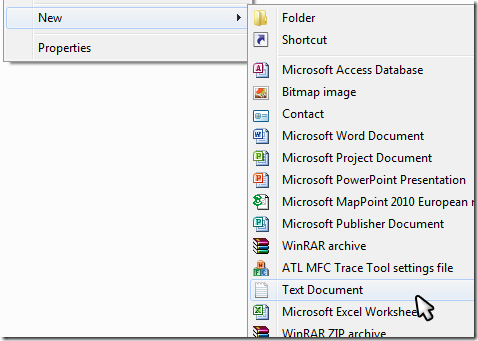
Rename it to installcmd.cmd. Go back to Visual Studio. In Solution Explorer select “Show All Files”:
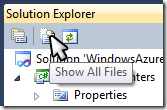
The installcmd.cmd should appear, you can now right-click it and select “Include in project”. Edit it to the following contents:
Code Snippet
- %~dp0InstallPerfCounters.exe /q /log %~dp0pc_install.htm
- exit /b 0
Now open the ServiceDefinition.csdef file from your cloud project and add a startup task:
Code Snippet
- <Startup>
- <Task commandLine="startup\installCmd.cmd" executionContext="elevated" taskType="simple" />
- </Startup>
This should take care of installing the performance counter. Now let’s use it in our worker role. First we need to create the performance counter instance, and then update it. In this simple example we’ll make the counter increment once each second. So implement the worker role’s run as follows:
Code Snippet
- public override void Run()
- {
- // This is a sample worker implementation. Replace with your logic.
- Trace.TraceInformation("UsingPerfCounters entry point called");
-
- const string categoryName = "U2U";
-
- PerformanceCounter secsRunning = new PerformanceCounter()
- {
- CategoryName = categoryName,
- CounterName = "# secs/running",
- MachineName = "." /* current machine */,
- InstanceName = Environment.MachineName,
- ReadOnly = false
- };
- var counterExists = PerformanceCounterCategory.Exists(categoryName);
-
- while (true)
- {
- Thread.Sleep(TimeSpan.FromSeconds(1));
- if (counterExists)
- {
- secsRunning.Increment();
- }
- Trace.WriteLine("Working", "Information");
- }
- }
Publish this solution in Azure, not forgetting to turn on Remove desktop.
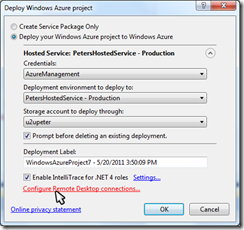
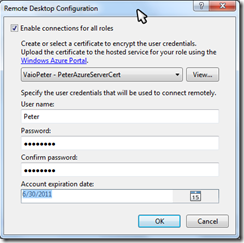
Also note that I turn in IntelliTrace, whichh is great for debugging those nasty deployment problems…
When you complete publishing you can now remote desktop to the instance and use PerfMon to look at your custom performance counter. Or you can use Azure Diagnostics….