1. Introducing Intelli-Trace
How do engineers figure out what caused a plane crash? One of the things they use is the black-box recording, which recorded all mayor data from the plane prior to the crash. This recording allows them to step back in time and analyze step-by-step what happened. Microsoft Visual Studio 2010 Ultimate also has a black-box for your code, called IntelliTrace. While your code is running, Intellitrace writes a log file (called an iTrace file), and you can analyze this using Visual Studio Ultimate. Windows Azure also allows you to enable Intellitrace on the server running your code, and this is ideal to figure out why your code is crashing on the server, especially early code (because you cannot attach the debugger).
In the next part you’ll walkthrough this process. But first you need to download the AzureAndIntelliTrace solution.
2. Deploying the solution
We’ll start by deploying the solution, so open the AzureAndIntelliTrace solution with Visual Studio. Right-click the Azure project and choose Publish… The Deploy Windows Azure project dialog should open.
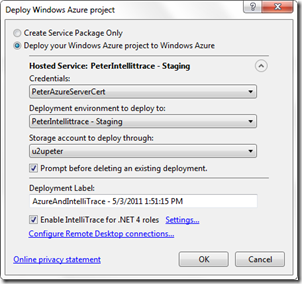
Make sure you check the “Enable IntelliTrace for .NET 4 roles” checkbox.
Let’s have a look at settings, so click the “Settings…” link. Open the Modules tab:
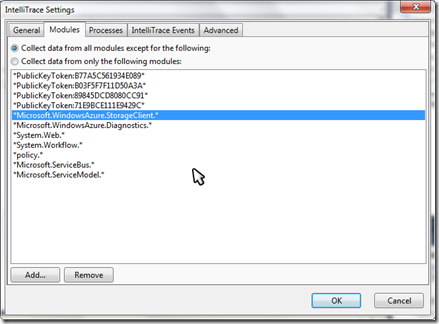
You can just leave everything to its default settings, but you could remove the StorageClient library if you would want to use intellitrace to track down a storage problem…
Wait for the deployment until it says “Busy…”. If something goes wrong during the startup fase of your role instance with IntelliTrace enabled, Azure will keep the role busy so you can download the iTrace file.

So you’re waiting for this:

Then it is time to download the iTrace file. You can do that from the Server Explorer window. Open the Windows Azure Compute tree item until you reach the instance (note the Busy state!):

The instance name will also mention whether or not it is IntelliTrace enabled.
Now you can right click the instance to download the iTrace file:
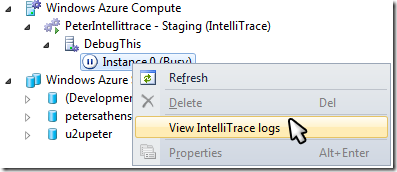
Wait for download to complete, the iTrace file should open automatically in Visual Studio:
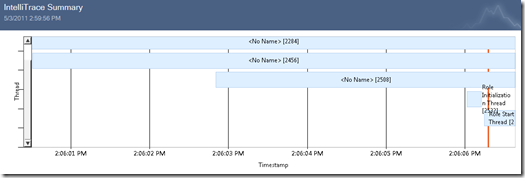
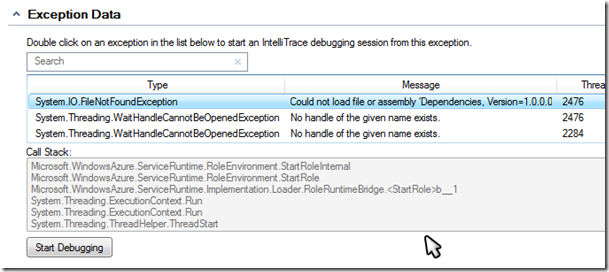
Scroll down until you reach the Exception Data section. You should see that you got a FileNotFoundException, caused because it couldn’t find the Dependencies assembly:
3. Fixing the dependency problem
This kind of problem is easily solved, but first we need to stop this deployment. Go back to the Windows Azure Activity Log and right-click the deployment. Choose “Cancel and remove”.
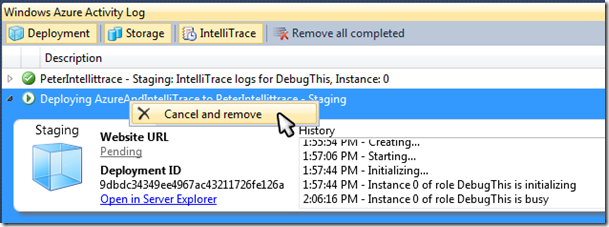
The problem is that we have a reference to the dependencies assembly, but when deployed to Azure it is not copied onto the instance. Go back to the solution and open the DebugThis project. Open the References folder and select the Dependencies assembly.
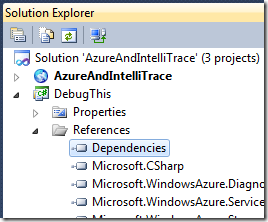
In the properties window set the “Copy Local” property to true.
Try redeploying again. Now we will have another problem, so wait for the instance to go Busy again…

Download the iTrace file again. Scroll down to the exceptions section, select the FormatException and click the Start Debugging button. IntelliTrace will put you on the offending line.
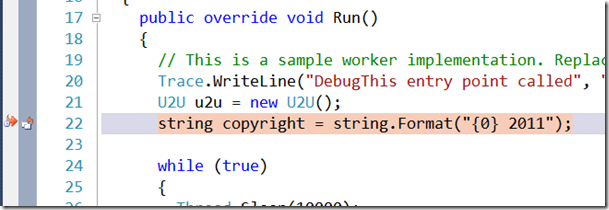
It is easy to see that the string.Format is missing an argument…
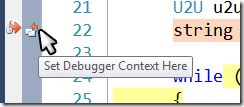
You can start the debugger by clicking the “Set Debugger Context Here” button in the gutter.
Now you can step back using intellitrace…
As you can see, IntelliTrace is great for figuring out this kind of problem, especially if your code works in the compute emulator, but doesn’t on the real Azure server instance…